
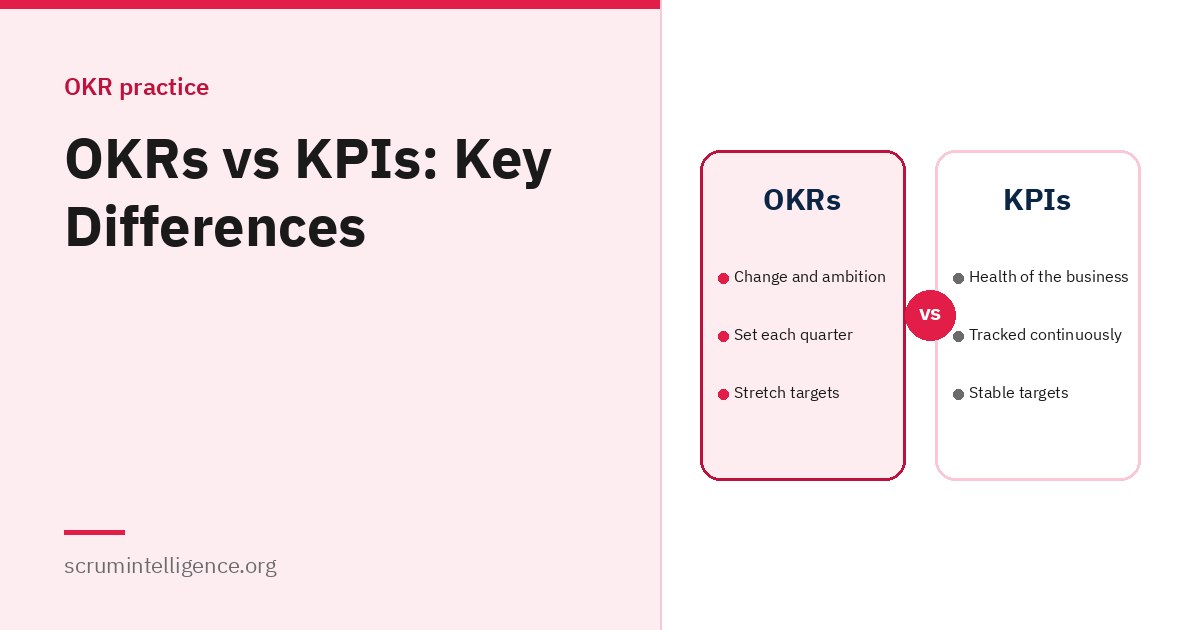
OKRs and KPIs are both used to measure what matters, so they are often confused. They serve different purposes. KPIs, or key performance indicators, track the ongoing health of a business, team or process. OKRs, or Objectives and Key Results, describe the few important changes you want to make in a period. Used together, they help organisations keep the business healthy while focusing on improvement. This guide explains the differences, how they work together and how to decide which to use.
Key takeaways
- KPIs monitor ongoing performance; OKRs drive specific improvements over a set period.
- KPIs are usually stable over time; OKRs change each cycle as priorities change.
- A KPI that needs significant improvement can become the basis for an OKR.
- KPIs can act as health measures that stop OKRs being achieved in harmful ways.
- Most organisations benefit from using both.
What is a KPI?
A key performance indicator is a measure an organisation tracks continuously to understand how well something is performing. Examples include monthly revenue, customer satisfaction, website uptime, average delivery time and employee turnover. KPIs are often shown on dashboards and reviewed regularly. Some organisations organise their KPIs using frameworks such as the Balanced Scorecard, introduced by Robert Kaplan and David Norton in 1992, which balances financial measures with measures of customers, internal processes and learning and growth.
What is an OKR?
An OKR combines an objective, a qualitative statement of what you want to achieve, with a small number of key results, measurable outcomes that show whether you achieved it. OKRs are typically set for a quarter and focus on change. For a full introduction, see our complete OKR guide.
OKRs vs KPIs: side by side
| KPIs | OKRs | |
|---|---|---|
| Purpose | Monitor ongoing health and performance | Drive focused improvement or change |
| Time frame | Continuous | A set period, often a quarter |
| Stability | Usually stable for long periods | Change each cycle as priorities change |
| Structure | A single measure with a target or range | An objective plus several key results |
| Ambition | Often "keep within a healthy range" | Often ambitious, sometimes deliberate stretch goals |
| Number | Can be many, across the organisation | Deliberately few, for focus |
| Question answered | "Are we healthy?" | "What are we trying to change now?" |
How OKRs and KPIs work together
KPIs show where improvement is needed
When a KPI moves outside a healthy range, or falls behind where the organisation wants it to be, that is often a signal for an OKR. For example, if customer satisfaction has fallen from 82 to 74, an OKR might aim to bring it back up by addressing specific causes.
OKRs change what KPIs measure
A successful OKR often moves a KPI permanently. Once the improvement is achieved, the KPI is monitored at its new level, and the team's focus moves to the next OKR.
KPIs protect against harmful shortcuts
KPIs can act as counter-measures, sometimes called health metrics or guardrails. If an OKR aims to reduce support handling time, a customer satisfaction KPI ensures the improvement is not achieved by rushing customers. See how to write good OKRs.
When a KPI becomes an OKR
A useful test: ask whether you want to maintain a measure or change it significantly. If you want to maintain it, it is a KPI. If you want to change it and are prepared to focus effort on doing so this period, it can become a key result in an OKR. For example:
- KPI: "Website uptime stays above 99.9%." (maintain)
- OKR: Objective "Make our service dependable for every customer." Key result "Reduce customer-affecting incidents from 8 to 3 per quarter." (change)
Examples by function
| Function | KPI (ongoing) | OKR key result (change this quarter) |
|---|---|---|
| Sales | Monthly revenue | Increase win rate on qualified opportunities from 20% to 28% |
| Support | Customer satisfaction score | Raise first-contact resolution from 65% to 80% |
| Engineering | Service uptime | Reduce time to restore service from 3 hours to 1 |
| Marketing | Monthly website visitors | Increase trial sign-ups from organic search from 400 to 650 a month |
| HR | Employee turnover | Reduce first-year leavers from 18% to 12% |
| Product | Weekly active users | Increase onboarding completion from 55% to 80% |
These are illustrations; real targets should come from your own data.
OKRs vs SMART goals
SMART goals, a term introduced by George T. Doran in a 1981 article, describe goals that are specific, measurable, assignable (often now "achievable"), realistic and time-related. Good key results share many SMART qualities. The difference is structure and intent: OKRs pair an inspiring objective with several measurable results, focus on a few priorities, and often include ambitious stretch goals, whereas SMART goals are usually individual, realistic targets.
Dashboards: showing both
Many organisations keep a KPI dashboard for ongoing health and a separate, shorter OKR view for current priorities. Keeping them visually distinct helps people understand which measures they are expected to maintain and which they are actively trying to change. For delivery teams, flow measures such as cycle time and throughput often work well as KPIs; see Kanban metrics explained.
How to choose good KPIs
- Linked to what matters: each KPI should connect to customer value, business health or a critical process.
- Actionable: if the KPI changes, someone knows what to investigate or do.
- Reliable: it is measured consistently, from trustworthy data.
- Understandable: people outside the team know what it means.
- Owned: someone is responsible for watching it and raising concerns.
- Few: a short list gets attention; a long one gets ignored.
Leading and lagging indicators
Lagging indicators show results after they happen, such as quarterly revenue or annual staff turnover. They are important but slow to react. Leading indicators move earlier and help predict lagging results, such as trial sign-ups for revenue, or first-month satisfaction for staff turnover. Good KPI sets and good key results usually include both: lagging indicators to confirm what matters in the end, and leading indicators to guide action in the meantime.
A worked example: a support team
As an illustration, a customer support team tracks four KPIs: customer satisfaction, first response time, first-contact resolution and ticket volume. For several months, satisfaction holds at around 4.5 out of 5, but first-contact resolution drifts down from 72% to 63%, and repeat contacts rise. The team decides to focus on this for a quarter and writes an OKR: objective "Solve customers' problems the first time", with key results "Raise first-contact resolution from 63% to 78%" and "Reduce repeat contacts about the same issue by 35%". Satisfaction and first response time remain KPIs, acting as health measures so that the improvement is not achieved by making customers wait longer. At the end of the quarter, first-contact resolution returns to a healthy level and becomes a KPI again at its new target.
Beware vanity metrics
A vanity metric looks impressive but does not help decisions, such as total registered users or page views without context. The term was popularised by Eric Ries in his 2011 book The Lean Startup. Vanity metrics make poor KPIs and even worse key results. Prefer measures that reflect real customer behaviour and value, such as active use, conversion or retention.
Reviewing KPIs and OKRs together
Many organisations find a simple rhythm works: teams review their OKRs weekly, and leaders review KPIs and OKR progress together monthly. The monthly review asks two questions: are our KPIs healthy, and are our OKRs moving? A KPI going wrong may justify changing priorities, and progress on OKRs may show which KPIs should move to new levels.
North Star metrics
Some organisations, especially product-led companies, choose a single "North Star" metric that best captures the core value customers get from the product, such as the number of customers who complete a key action each week. A North Star metric behaves like a very important KPI: it is tracked continuously and stays stable for a long time. OKRs can then focus on specific changes expected to move it. The risk is over-simplifying: one number rarely captures everything that matters, so it should sit alongside other health measures.
KPIs for agile delivery teams
Delivery teams often track a small set of KPIs about how well they deliver. Common choices include cycle time, throughput and escaped defects; see Kanban metrics explained. Many software teams also use the four key metrics from the DevOps Research and Assessment (DORA) research, described in the 2018 book Accelerate by Nicole Forsgren, Jez Humble and Gene Kim: deployment frequency, lead time for changes, change failure rate and time to restore service. These make good KPIs, and when one needs major improvement, a good basis for an OKR.
From KPI to OKR and back
As an illustration: an engineering team tracks deployment frequency as a KPI. It has been stuck at once a month, holding the product back. The team sets an OKR for the quarter, with a key result to deploy at least weekly. It automates testing and simplifies approvals, and by the end of the quarter deploys twice a week. Deployment frequency returns to being a KPI, now monitored at its new, healthier level, and the team's next OKR focuses elsewhere.
Common mistakes
- Turning every KPI into an OKR: focus is lost when everything is a priority.
- Using OKRs for business-as-usual: routine measures belong in KPIs.
- Ignoring KPIs while chasing OKRs: health can decline unnoticed.
- Too many KPIs: dashboards full of measures nobody acts on.
- Treating ambitious OKR targets like KPI commitments: aspirational key results are not expected to be fully achieved.
OKRs and KPIs in agile teams
For Scrum Teams, KPIs often describe the health of the product and the team's delivery, while OKRs connect the team's work to organisational priorities through the Product Goal and Sprint Goals. See OKRs and Scrum for how they fit together.
Learn more
Scrum Agile OKR Plus covers using OKRs with agile teams; it includes self-paced training and an online exam on ExamVault by CertExpert with three attempts included, and the certificate and digital badge are valid for two years. See the certification page for current learning paths and prices.
Frequently asked questions
What is the main difference between OKRs and KPIs?
KPIs monitor ongoing performance; OKRs drive focused change over a set period.
Can a KPI be a key result?
Yes. A KPI you want to change significantly this period can become a key result, with a baseline and target.
Do we need both OKRs and KPIs?
Most organisations benefit from both: KPIs to keep the business healthy and OKRs to focus improvement.
How many KPIs should a team track?
Only as many as it will actually review and act on. A short, focused set is more useful than a long list.
Are OKRs better than KPIs?
Neither is better; they do different jobs.
What is a health metric?
A measure, often a KPI, used to make sure an OKR is not achieved in a harmful way.
What is the Balanced Scorecard?
A framework introduced by Robert Kaplan and David Norton in 1992 that balances financial measures with customer, internal process and learning and growth measures.
How are OKRs different from SMART goals?
OKRs pair an inspiring objective with several measurable results and often include stretch goals; SMART goals are usually single, realistic targets.